Track key metrics, set baselines, watch queries, and alert before users feel pain.
If you want a fast app, you must know how to monitor database performance. I have helped teams rescue busy systems in peak hours, and I know what works. This guide shows a clear, practical path. You will learn the tools, the steps, and the habits that keep your database fast and safe.
Why database performance monitoring matters
Your users judge speed in seconds. Your business feels every delay. Knowing how to monitor database performance lets you spot risk before it hits your customers.
Good monitoring reduces outages and cost. It shrinks support tickets. It gives your team the insight to act with calm, not panic.
Focus on user impact. Track service level goals for latency and error rates. Build habits that make results clear and repeatable.
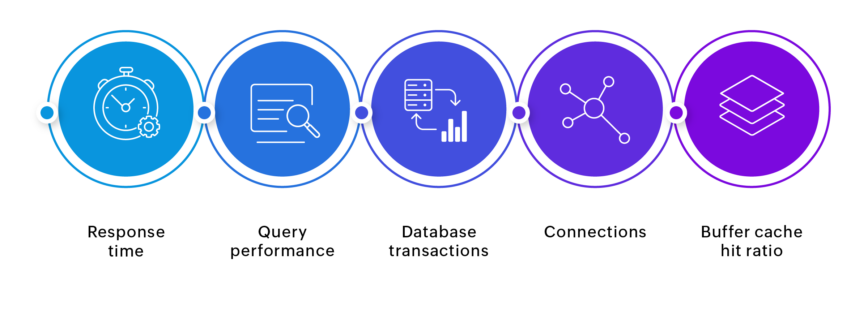
Core metrics you must track
Start with the golden signals. Latency, throughput, error rate, and saturation guide most decisions. These numbers help you understand how to monitor database performance day to day.
Look deeper inside the database engine. Track:
- Query latency p50, p95, p99 helps spot tail pain.
- Wait events and lock time shows why queries stall.
- Active connections and queue length shows load.
- Buffer cache hit ratio can help, but do not chase it alone.
- Errors, timeouts, and retries warn you early.
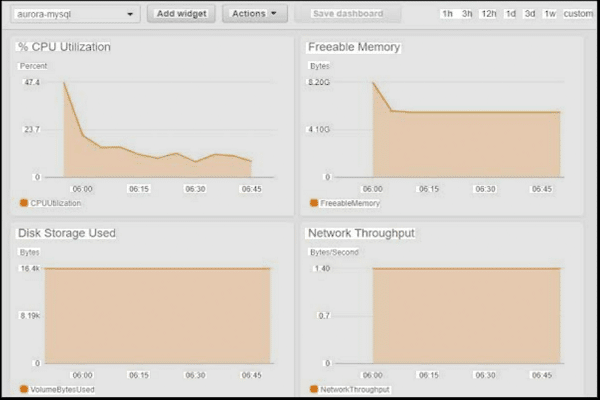
Watch the host too. CPU ready, memory pressure, disk IOPS, and network latency shape database speed. Correlate these with query metrics.

Tools and instrumentation for popular engines
You do not need fancy tools to learn how to monitor database performance. Start with what your engine gives you. Add external tools as you grow.
For PostgreSQL:
- pg_stat_statements shows top queries by time and calls.
- auto_explain logs slow plans during spikes.
- pg_stat_activity, locks views, and extension metrics reveal waits and blockers.
For MySQL and MariaDB:
- performance_schema exposes waits and stages.
- Slow query log and pt-query-digest summarize heavy SQL.
- sys schema gives human-friendly views.
For SQL Server:
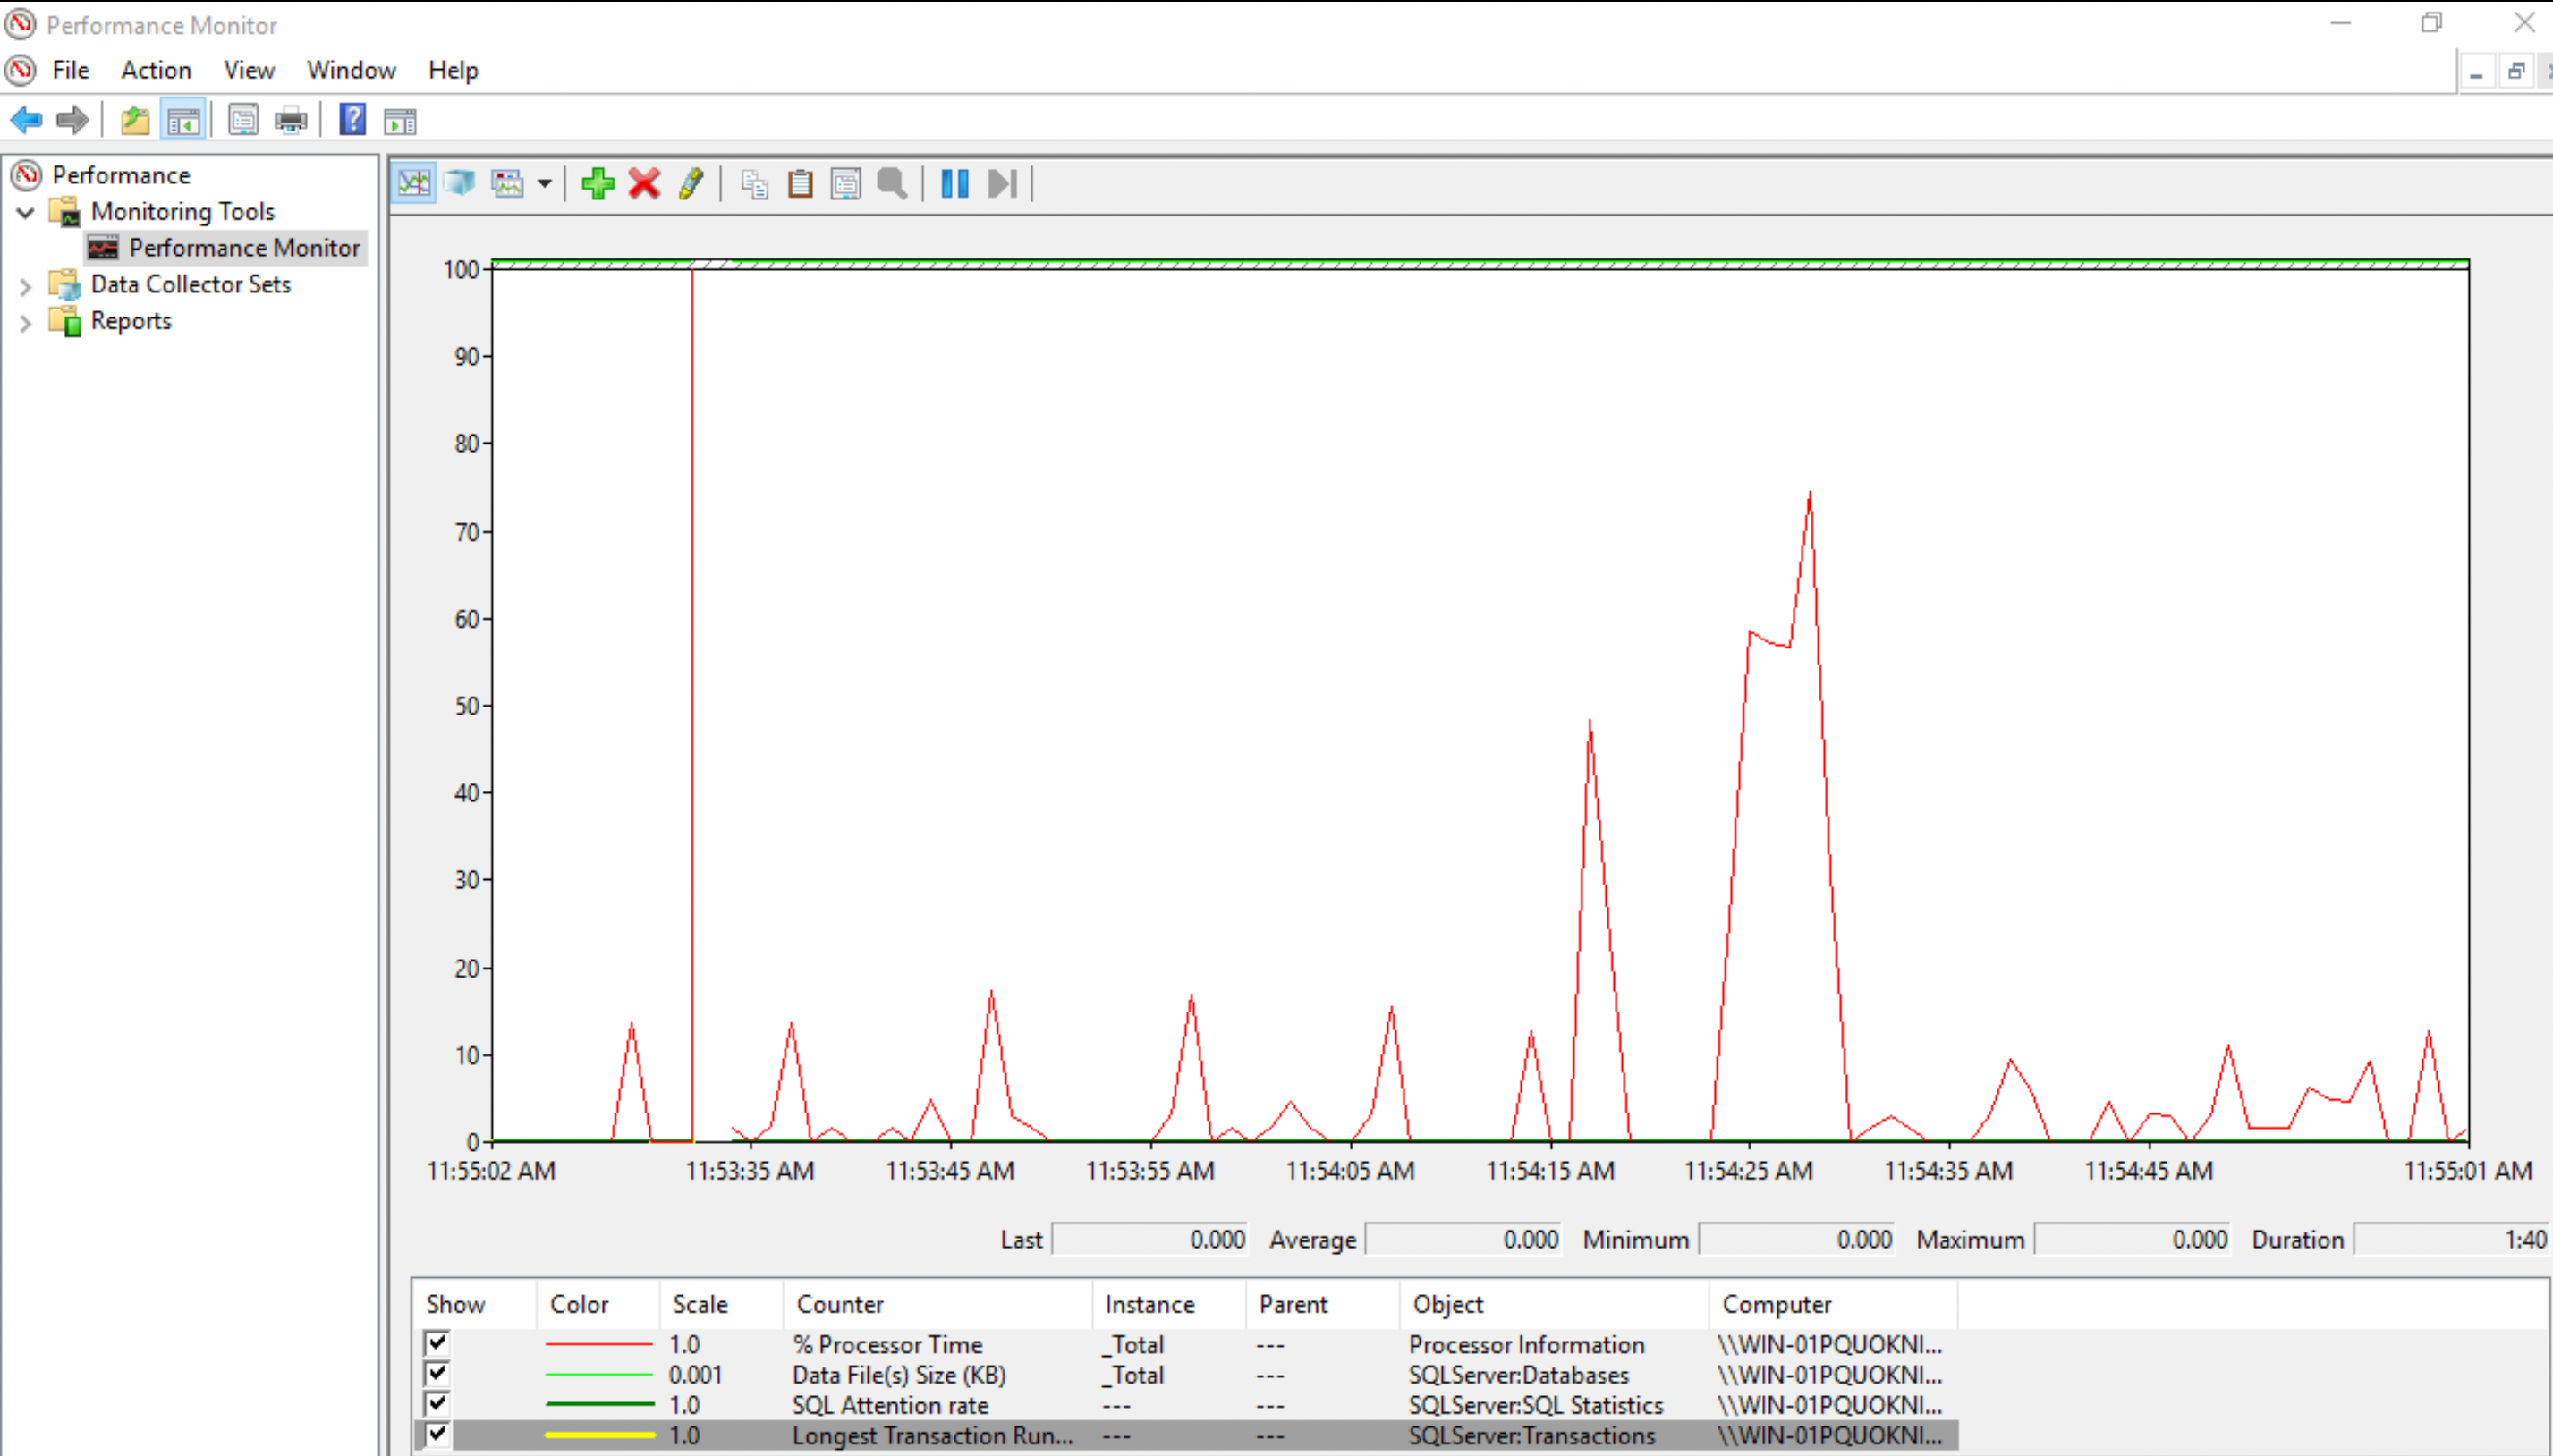
- Dynamic Management Views reveal waits, IO, and memory.
- Query Store captures plans and regressions.
For Oracle:
- AWR and ASH offer deep wait event details.
- SQL Monitor surfaces heavyweight SQL.
For NoSQL:
- MongoDB profiler, FTDC metrics, and explain help tune queries and indexes.
- Redis SLOWLOG, INFO stats, and latency monitor point to hot keys.
- Cassandra exposes metrics for read/write latency and compaction.
Observability stack:
- Prometheus and Grafana for metrics and dashboards.
- OpenTelemetry for traces across app and DB.
- APM tools tie transactions, queries, and errors together.
A step-by-step strategy that works
This is the path I use when teams ask how to monitor database performance. It is simple and it scales.
- Define goals and SLOs. Example: p95 query time under 200 ms, error rate under 1%.
- Baseline normal. Measure peak and off-peak for two weeks. Save snapshots.
- Enable the right logs. Collect slow queries, waits, and critical errors.
- Sample wisely. High rate for key services. Lower rate for batch jobs.
- Build clear dashboards. Start with golden signals, then top queries.
- Set alerts on symptoms. Alert on p95 latency, saturation, and timeouts. Avoid noisy CPU-only alerts.
- Write runbooks. Include what to check first, commands to run, and who to call.
- Review weekly. Compare drift from baseline. Tune thresholds and add missing views.
Query tuning and indexing in practice
Most wins come from a few heavy queries. That is why learning how to monitor database performance must include query tuning. Use your engine’s explain to see the plan.
Key tips:
- Aim for the right index. Create a composite index in the order of filters. Make it cover the select list when possible.
- Avoid wildcards at the start of LIKE. They block index use.
- Use pagination with keyset when offsets get large. It cuts latency in half in many apps.
- Watch parameter sniffing and plan cache. Pin or hint plans only when you must.
- Reduce round trips. Batch reads and writes. Fix N+1 patterns in the app.
Example workflow I use:
- Find top 5 queries by time.
- EXPLAIN each one.
- Check rows scanned versus rows returned.
- Add or adjust an index.
- Recheck the plan and p95. Keep notes for the team.
Capacity planning and scaling
You cannot tune past hard limits. Part of how to monitor database performance is to plan ahead. Know where growth will hit first.
Plan for:
- Connections. Use a pool. Keep pools small and steady.
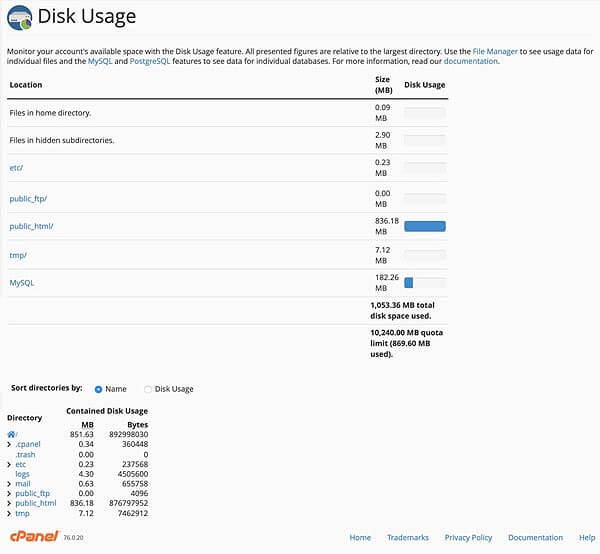
- Storage. Track write amplification and growth per day. Leave 20–30% headroom.
- IO. Ensure IOPS and throughput meet peak demand. Watch queue depth.
- Memory. Keep working set hot. Add read replicas if needed.
- Vacuum and maintenance. In Postgres, watch bloat and autovacuum lag. In MySQL, plan for index rebuilds when needed.
Scale with care:
- Vertical first for quick wins.
- Horizontal with replicas for reads.
- Shard only with strong keys and strict limits.
Troubleshooting playbooks for common issues
Playbooks bring calm during incidents. They also teach new team members how to monitor database performance under stress.
High latency spike:
- Check recent deploys. Roll back if needed.
- Look at p95 query time, active connections, and top waits.
- Find heavy queries and add quick fixes. Drop bad hints. Add a hot index if safe.
Locking and deadlocks:
- Find blockers and wait chains.
- Kill the least risky blocker. Add missing indexes to reduce scans.
- Shorten transactions. Use consistent access order to cut deadlocks.
IO saturation:
- Confirm with disk metrics and waits.
- Reduce random reads with better indexes and cache.
- Spread writes. Tune checkpoints and flush settings with care.
Replication lag:
- Check slow queries on the primary.
- Optimize long-running transactions.
- Consider delayed or larger replica instances.
Alerting, SLOs, and dashboards that tell the truth
Your alerts should reflect user pain. This is the heart of how to monitor database performance with confidence.
Set alerts on:
- p95 and p99 query time above SLO for 5–10 minutes.
- Error rate, timeouts, or saturation above threshold.
- Replication lag beyond your recovery point.
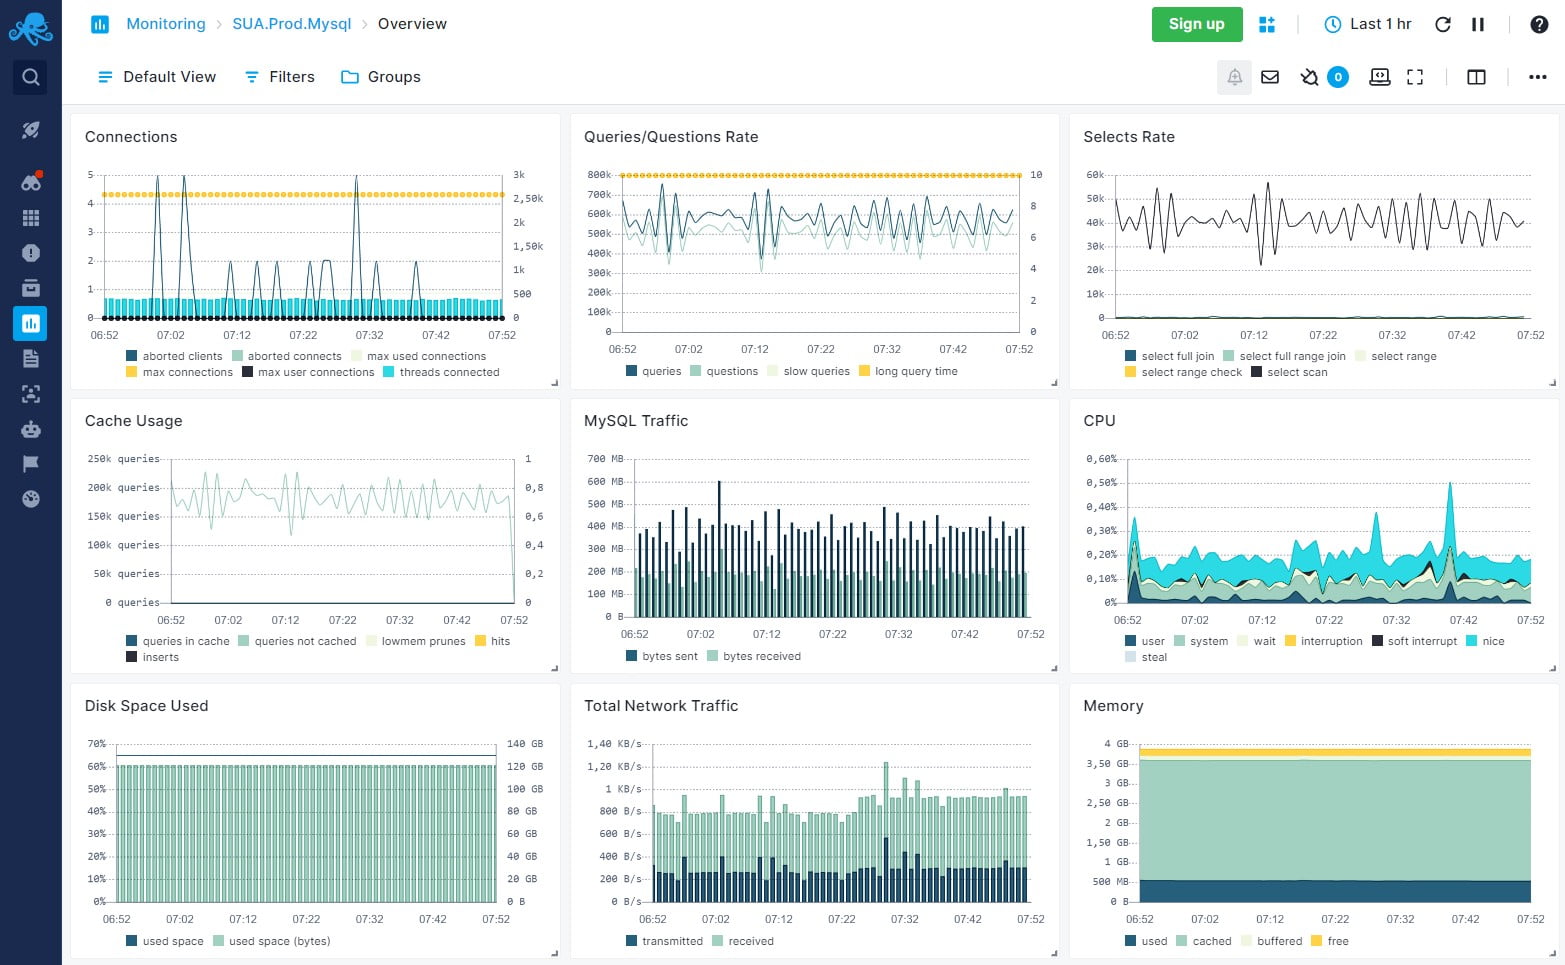
Build dashboards with:
- Top-level golden signals.
- Top queries by total time and calls.
- Waits and lock heatmaps.
- Host and storage metrics next to query graphs.
Use error budgets to pace change. If you burn budget, slow deploys and tune before you ship more risk.
Security, privacy, and compliance in monitoring
Monitoring can leak secrets if you are not careful. You still need insight while you protect data.
- Redact PII in logs and traces. Mask values and hash tokens.
- Use least privilege for agents and collectors. Rotate keys.
- Keep logs for only as long as you need. Set clear retention rules.
- Validate backups and test restores. A fast restore is part of performance safety.
These controls raise trust. They also help audits go smoothly.
Real-world lessons from the field
I once helped a retail site on a holiday sale day. The team asked how to monitor database performance with little time left. We focused on p95 latency, slow queries, and lock waits. Within an hour, one new index cut checkout time by 40%.
Another time, a startup hit a wall at 10x traffic. Their cache hit rate hid a growing problem. Wait events told the truth. IO was stuck. We moved to faster storage, trimmed heavy queries, and set a firm pool size. The site stayed stable through launch week.
Small habits win:
- Review top queries every Friday.
- Keep one living runbook.
- Tie alerts to user impact, not noise.
Frequently Asked Questions of how to monitor database performance
What is the first step to monitor database performance?
Define your SLOs and baseline normal behavior. Without a baseline, you cannot tell signal from noise.
Which metrics matter most?
Start with latency, throughput, error rate, and saturation. Then add waits, locks, and top queries.
How often should I review dashboards?
Check daily for trend drift and weekly for deeper review. Use alerts to catch real spikes in between.
Do I need paid tools to monitor well?
No, start with built-in engine views and open-source stacks. Paid tools can help at scale or for complex estates.
How do I avoid alert fatigue?
Alert on user pain and long-lived issues, not single spikes. Tune thresholds and require short actions in every alert.
What is a safe slow query threshold?
Begin at 500 ms for OLTP and adjust by SLO and user need. Use p95 and p99, not only averages.
How can I speed up reports without hurting the primary?
Use read replicas or a warehouse for heavy reports. Run them off-peak and ensure proper indexing.
Conclusion
You now have a clear plan to keep your database fast and calm. Learn how to monitor database performance with simple metrics, smart tools, and steady habits. Tune the few heavy queries, set honest alerts, and review trends each week.
Pick one system today and build the first dashboard. Add one alert and one runbook. Then share the wins with your team. Want more guides like this? Subscribe, leave a comment, or ask a question for the next deep dive.