Use lightweight agents, baselines, dashboards, and smart alerts to track CPU load.
If you want a clear, reliable plan for how to monitor server cpu load, you’re in the right place. I’ve spent years helping teams avoid outages and performance lag. This guide breaks down the steps, tools, and habits that actually work. By the end, you’ll know how to monitor server cpu load with confidence and turn data into action.
What CPU load really means (and why it spikes)
CPU load shows how much work your CPU is asked to do. CPU utilization is the percent of time cores are busy. Load average is the average number of runnable or waiting tasks. Both matter when learning how to monitor server cpu load.
Think of your CPU like a checkout line. Utilization is the cashier being busy. Load is the number of people waiting. High load with low utilization often points to waiting on disk, network, or locks.
On multi-core servers, compare load to core count. A load average of 8 on 8 cores is fine. A load of 8 on 2 cores means a big queue and likely slowdowns.
The key CPU metrics you should track
To master how to monitor server cpu load, focus on the metrics that explain cause, not just symptoms.
Core metrics to watch:
- CPU utilization total Tracks how busy CPUs are overall.
- User time Work done by your code and apps.
- System time Kernel work like I/O and interrupts.
- I/O wait Time spent waiting on disk I/O.
- Steal time Time taken by the hypervisor on shared hosts.
- Load average 1, 5, 15 minute run queue sizes.
- Run queue length How many tasks are waiting to run.
- Context switches How often the OS switches tasks.
- CPU throttling Frequency scaling or limits due to power or thermal issues.
- Per-core usage Helps you see imbalance or single-thread bottlenecks.
Healthy rule-of-thumb thresholds:
- CPU total under 70% during normal load; short peaks to 85–90% are okay.
- Load average close to or under number of cores.
- I/O wait under 10%; sustained above 20% hints at disk bottlenecks.
- Steal under 2% on cloud VMs; above 5% is a sign to move instance types.
These help you decide how to monitor server cpu load with fewer false alarms.

Built-in tools to check CPU load fast (Linux, Windows, macOS)
You do not need fancy tools to start. When you wonder how to monitor server cpu load on the spot, built-ins are your friend.
Linux:
- top or htop Quick view of per-process CPU and load.
- uptime Shows the 1/5/15 minute load averages.
- vmstat 1 CPU, run queue, context switches, and I/O wait trends.
- mpstat -P ALL Per-core breakdown.
- sar Historical CPU trends if sysstat is enabled.
- pidstat -u Per-process CPU over time.
- Task Manager Simple overview and per-core charts.
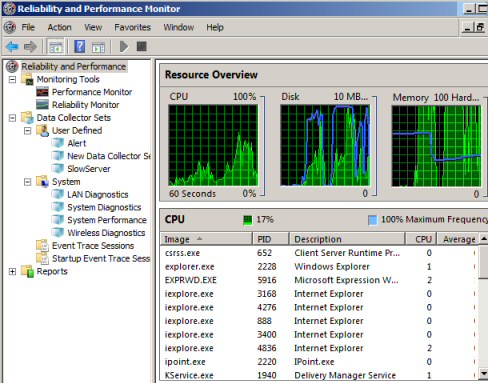
- Resource Monitor Deeper per-process and per-service usage.
- Performance Monitor Counters like Processor(_Total)% Processor Time and System\Processor Queue Length.
- Windows Admin Center Central dashboards for servers.
macOS:
- Activity Monitor App view for CPU per process.
- top -l 1 Terminal snapshot with load and CPU per process.
These tools help you learn how to monitor server cpu load right from the OS, no setup needed.
 monitoring stack that scales"
style="max-width: 100%; height: auto; border: 2px solid black; border-radius: 10px; display: block; margin: 0 auto;"
loading="lazy"
/>
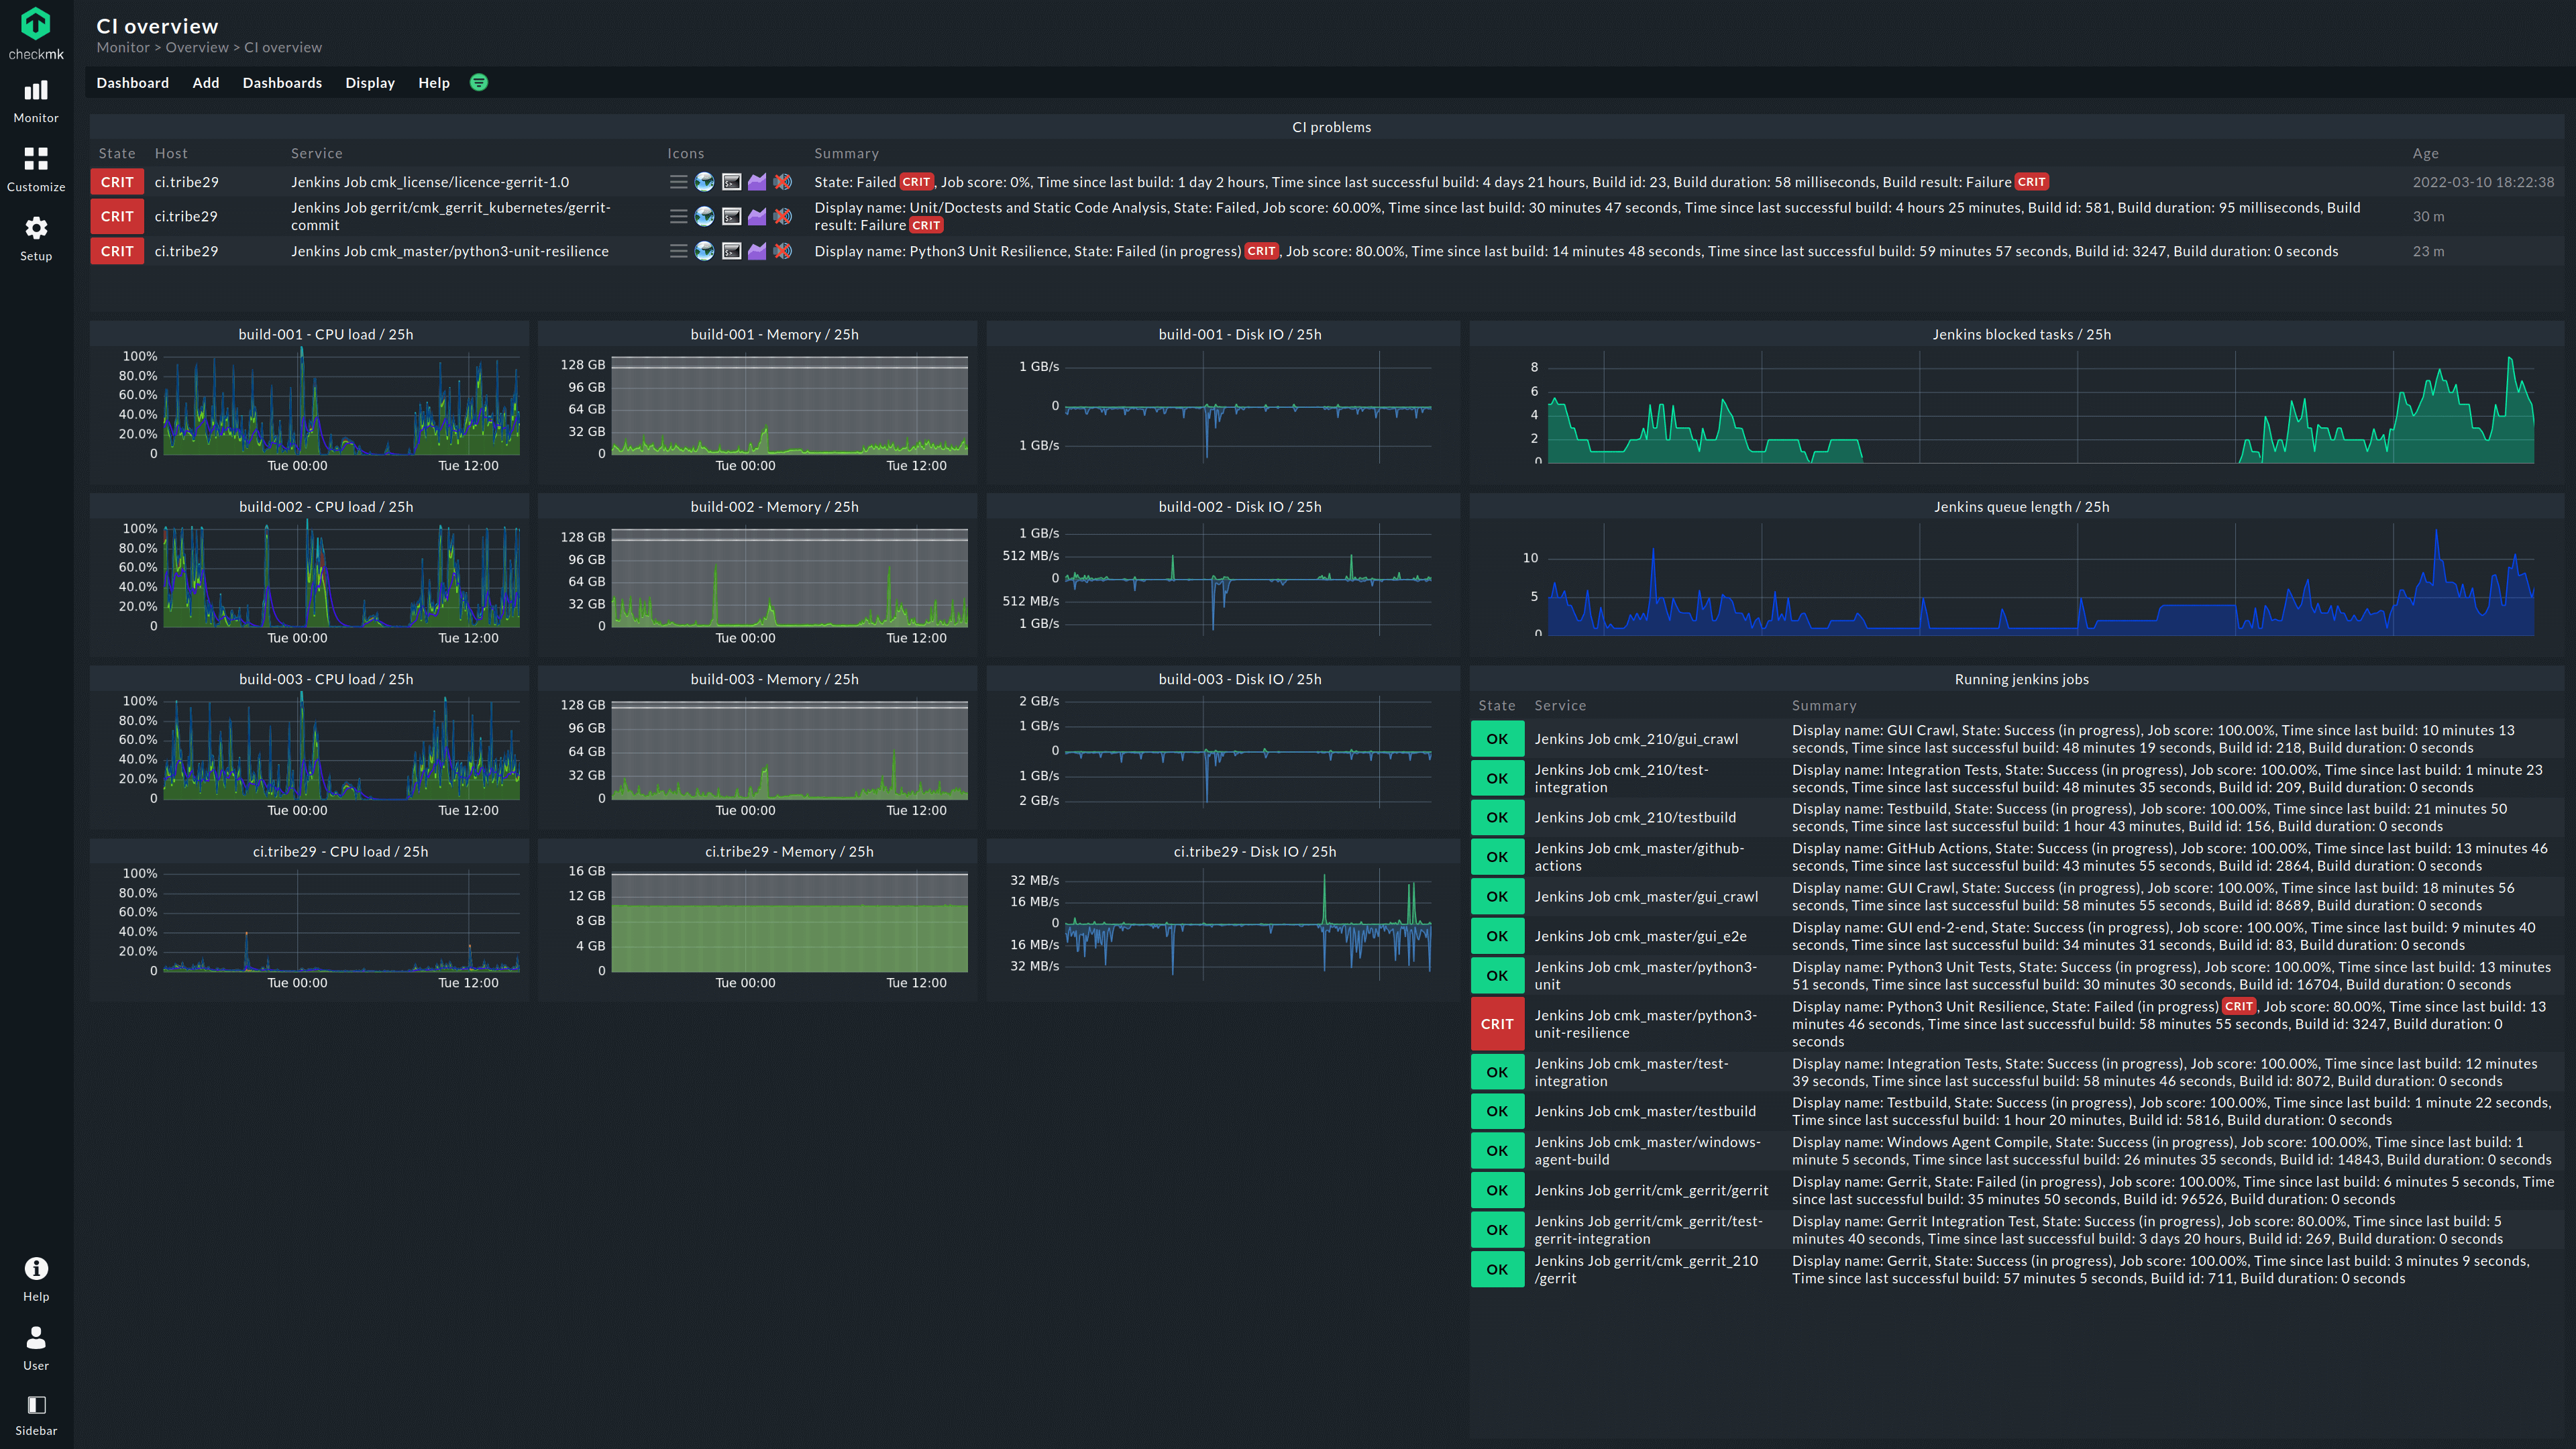
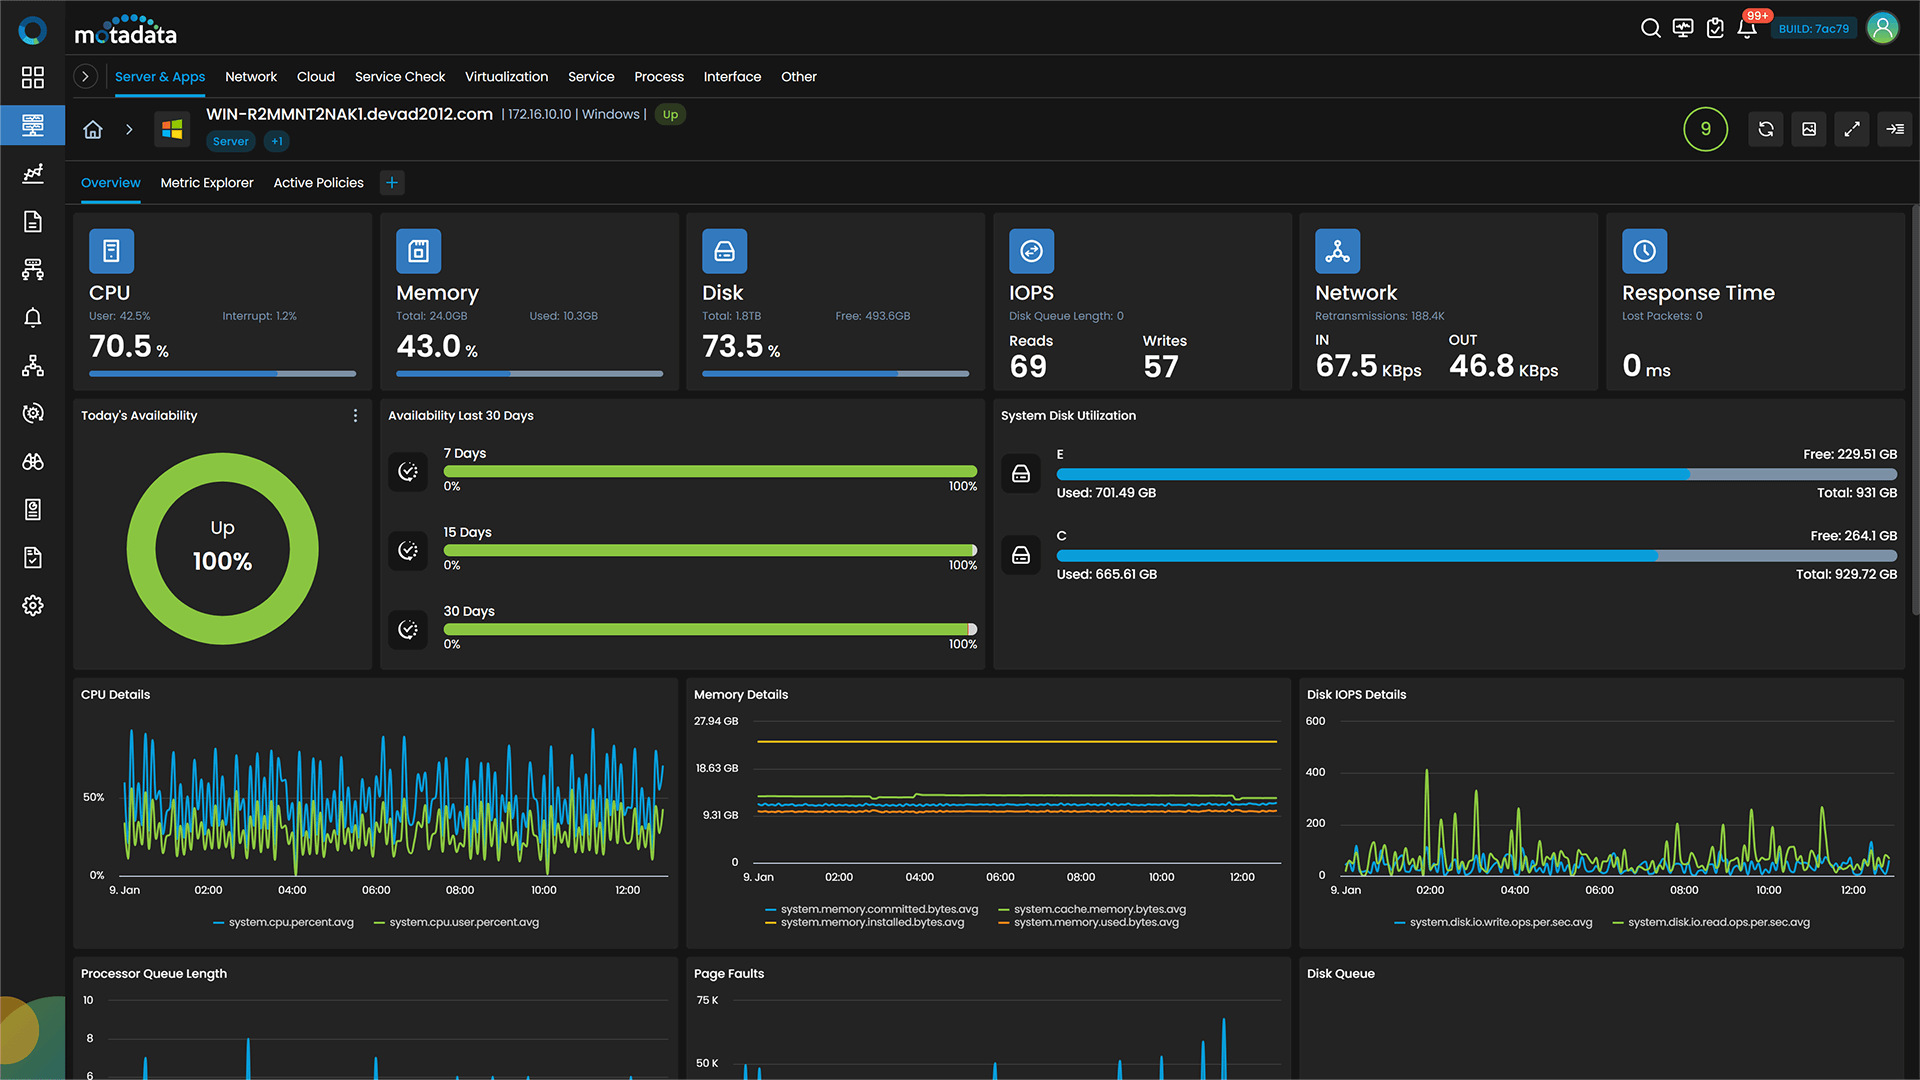
Set up a monitoring stack that scales
If you need ongoing visibility, build a stack. This is where you make how to monitor server cpu load consistent across many servers.
Popular open-source approach:
- Prometheus Scrapes metrics on a time series basis.
- node_exporter Exposes CPU, load, and system metrics on Linux.
- Grafana Dashboards and alerts with templates you can reuse.
- Alertmanager Routes alert notifications.
Quick start steps:
- Install node_exporter on each server. Run it as a service on port 9100.
- Install Prometheus and add targets for your servers.
- Import a Grafana dashboard for CPU and load.
- Set alerts for sustained CPU over 80% for 5 minutes and load above core count.
Hosted options:
- Datadog, New Relic, or Elastic Cloud Rich dashboards, APM, and smart alerts.
- CloudWatch, Azure Monitor, or Cloud Monitoring Good fit if you stay within one cloud.
This stack makes how to monitor server cpu load repeatable, auditable, and team-friendly.
Alerting and thresholds that reduce noise
Alerts should catch real problems and ignore noise. When you plan how to monitor server cpu load, focus on duration, not a single spike.
Smart alert ideas:
- CPU total above 85% for 5 minutes Warn; above 95% for 10 minutes Critical.
- Load average above core count for 10 minutes on the 15-minute average.
- I/O wait above 20% for 10 minutes points to disk saturation.
- Steal above 5% for 5 minutes signals noisy neighbor on shared hosts.
Tips I use in the field:
- Use rolling averages to avoid flapping.
- Group by service or cluster to avoid paging for one noisy pod.
- Include context in alerts top 5 processes, recent deploys, and node role.
- Tie alerts to SLOs; not every spike needs a page.
This approach makes how to monitor server cpu load calm and actionable.

Troubleshooting high CPU like a pro
Here is my step-by-step method, used many times when teams ask me how to monitor server cpu load during incidents.
Rapid triage:
- Confirm the metric Is it CPU or load? Check per-core and run queue.
- Find the hot process With top, htop, pidstat, Task Manager, or PerfMon.
- Check I/O wait If high, it may be disk or network, not CPU.
Deep dive:
- Thread-level hotspots Use htop H to see threads; on Java, jstack; on .NET, dotnet-trace; on Node, clinic.
- Check app logs for recent errors, timeouts, or spikes.
- Look for code paths that loop, lock, or sort large data in memory.
- Watch GC metrics on JVM or .NET; long GC pauses can mimic CPU spikes.
A quick story: a team saw 200% CPU on a 4-core VM and thought scaling was needed. We found a new regex in a logging filter that went quadratic with long lines. Fixing the pattern cut CPU by 70%. That is why how to monitor server cpu load must include app-level clues, not just charts.

Capacity planning and optimization
Good teams plan before traffic hits. This is a key part of how to monitor server cpu load with business goals in mind.
Plan and tune:
- Baseline during calm periods Track peak hour, daily, and weekly patterns.
- Right-size instances Choose CPU-optimized types for compute-heavy apps.
- Use autoscaling React to sustained CPU and queue depth, not short spikes.
- Cache repeat work Add in-memory caches or CDNs to cut CPU-heavy calls.
- Optimize queries Add indexes, reduce N+1 calls, and batch writes.
- Parallelize or offload Push long tasks to background workers or queues.
Use load testing to validate capacity before a launch. Compare test results to your baselines. This turns how to monitor server cpu load into a predictable practice.
Security and anomaly detection for CPU spikes
Sometimes high CPU is not a bug. It can be an attack or malware. This angle matters in how to monitor server cpu load across internet-facing hosts.
What to watch:
- Sudden, sustained CPU with unknown processes Possible cryptominers.
- High outbound traffic with CPU spikes Data exfiltration or botnets.
- Unexpected sudo or cron changes Persistence tactics.
- Steal time increases on shared VMs Noisy neighbor or placement issues.
Add anomaly alerts that learn normal patterns for a host or service. Use eBPF-based tools or EDR agents to trace unknown executables. This completes how to monitor server cpu load with a security lens.
Best practices checklist you can use today
If you need a quick plan for how to monitor server cpu load, start here.
Daily habits:
- Track CPU total, per-core, load average, I/O wait, and steal time.
- Use dashboards that show 1, 5, 15 minute load with core count.
- Alert on sustained issues, not brief peaks.
- Tag servers by role and environment to filter noise.
- Review top offenders weekly and file tickets to fix hot functions.
Documentation and hygiene:
- Record baselines after every deploy and major config change.
- Keep runbooks for Linux, Windows, and app stacks.
- Set clear ownership for alerts and escalation paths.
- Test alerts in staging so you know they fire with the right context.
Do this and your plan for how to monitor server cpu load will be stable and easy to run.
Frequently Asked Questions of how to monitor server cpu load
What is a good CPU load average?
A good load average is close to or below your core count. If you have 8 cores, a load near 8 is usually fine, while 16 means many tasks are waiting.
How often should I sample CPU metrics?
Every 15 seconds is a common balance of detail and cost. For bursty apps, 5 seconds can help, but smooth with rolling averages.
Which is better to alert on, CPU percent or load average?
Use both. CPU percent shows utilization, while load average shows queue pressure, which can flag I/O waits and lock contention.
How do I tell if high CPU is from my code or the system?
Check user time versus system time. High user time points to your app, while high system time or I/O wait suggests kernel, disk, or network work.
What causes high CPU steal time on VMs?
Steal time rises when the hypervisor deprioritizes your VM. Move to a different instance type, host, or region if it stays above 5%.
Are short CPU spikes a problem?
Short spikes are normal for many apps. Alert only on sustained CPU use to avoid noise and false positives.
How can I see which thread is hot?
Use htop with thread view, pidstat, or language tools like jstack for Java. Thread-level data reveals single-thread bottlenecks on multi-core CPUs.
What dashboards should I build first?
Start with CPU total, per-core, load average, I/O wait, and top processes. Add deploy markers so you can link code changes to CPU shifts.
Conclusion
You now have a clear plan for how to monitor server cpu load from quick checks to full monitoring stacks. Track the right metrics, set calm alerts, and use a proven troubleshooting flow. Keep baselines, automate dashboards, and review outliers every week.
Start today. Install an agent, build one CPU dashboard, and add a single alert. Then iterate. If this guide helped, subscribe for more hands-on ops playbooks or share your favorite tips in the comments.