Use automated monitoring tools to track CPU, memory, disk, network, and alerts.
If you run servers, you need a clear plan for how to monitor server health metrics. I have spent years building dashboards and fixing 3 a.m. alerts. I will show you what matters, what to ignore, and how to act fast. By the end, you will know how to monitor server health metrics with clarity and calm.

Why server health metrics matter
Server health is the heartbeat of your app. If it slips, users feel it fast. Slow pages, failed checkouts, and lost trust follow.
Good monitoring cuts risk. It shows trends before trouble hits. It helps you plan capacity and control cost. It also proves uptime to your team and your boss.
I will use simple words and clear steps. You will learn how to monitor server health metrics in a way that fits any stack or budget. You can start small and grow as you need.

The key metrics to track
You do not need every metric. You need the right ones. Here is a clear set that works in most cases.
CPU
Watch usage, load average, and steal time on VMs. Aim for headroom under peak load. Many teams try to keep average CPU under 70 to 80 percent.
Memory
Track used, free, and cache. Watch swap in and out. High swap often means pain. Look for leaks in long-running apps.
Disk and file systems
Track disk I/O, read and write latency, and queue depth. Watch disk space and inodes. Keep at least 20 percent free to avoid slowdowns.
Network
Check bandwidth, packet loss, errors, and latency. Watch connections and SYN backlog. Spikes here often look like app bugs to users.
Processes and services
Track process count, restarts, and exit codes. Watch service status and response time. Tie these to your app health checks.
Application metrics
Follow request rate, error rate, and latency. These show user impact first. Use percentiles like p95 and p99 to catch tail pain.
System events and logs
Collect syslog, kernel messages, and app logs. Use pattern alerts for recurring failures. Link logs to metric spikes for fast root cause.
Hardware and host signals
For bare metal, watch temperature, fan speed, and power. For cloud, check throttling, credits, and instance limits.
These are the core of how to monitor server health metrics. Keep the set small and clear. Add more only when it solves a real need.

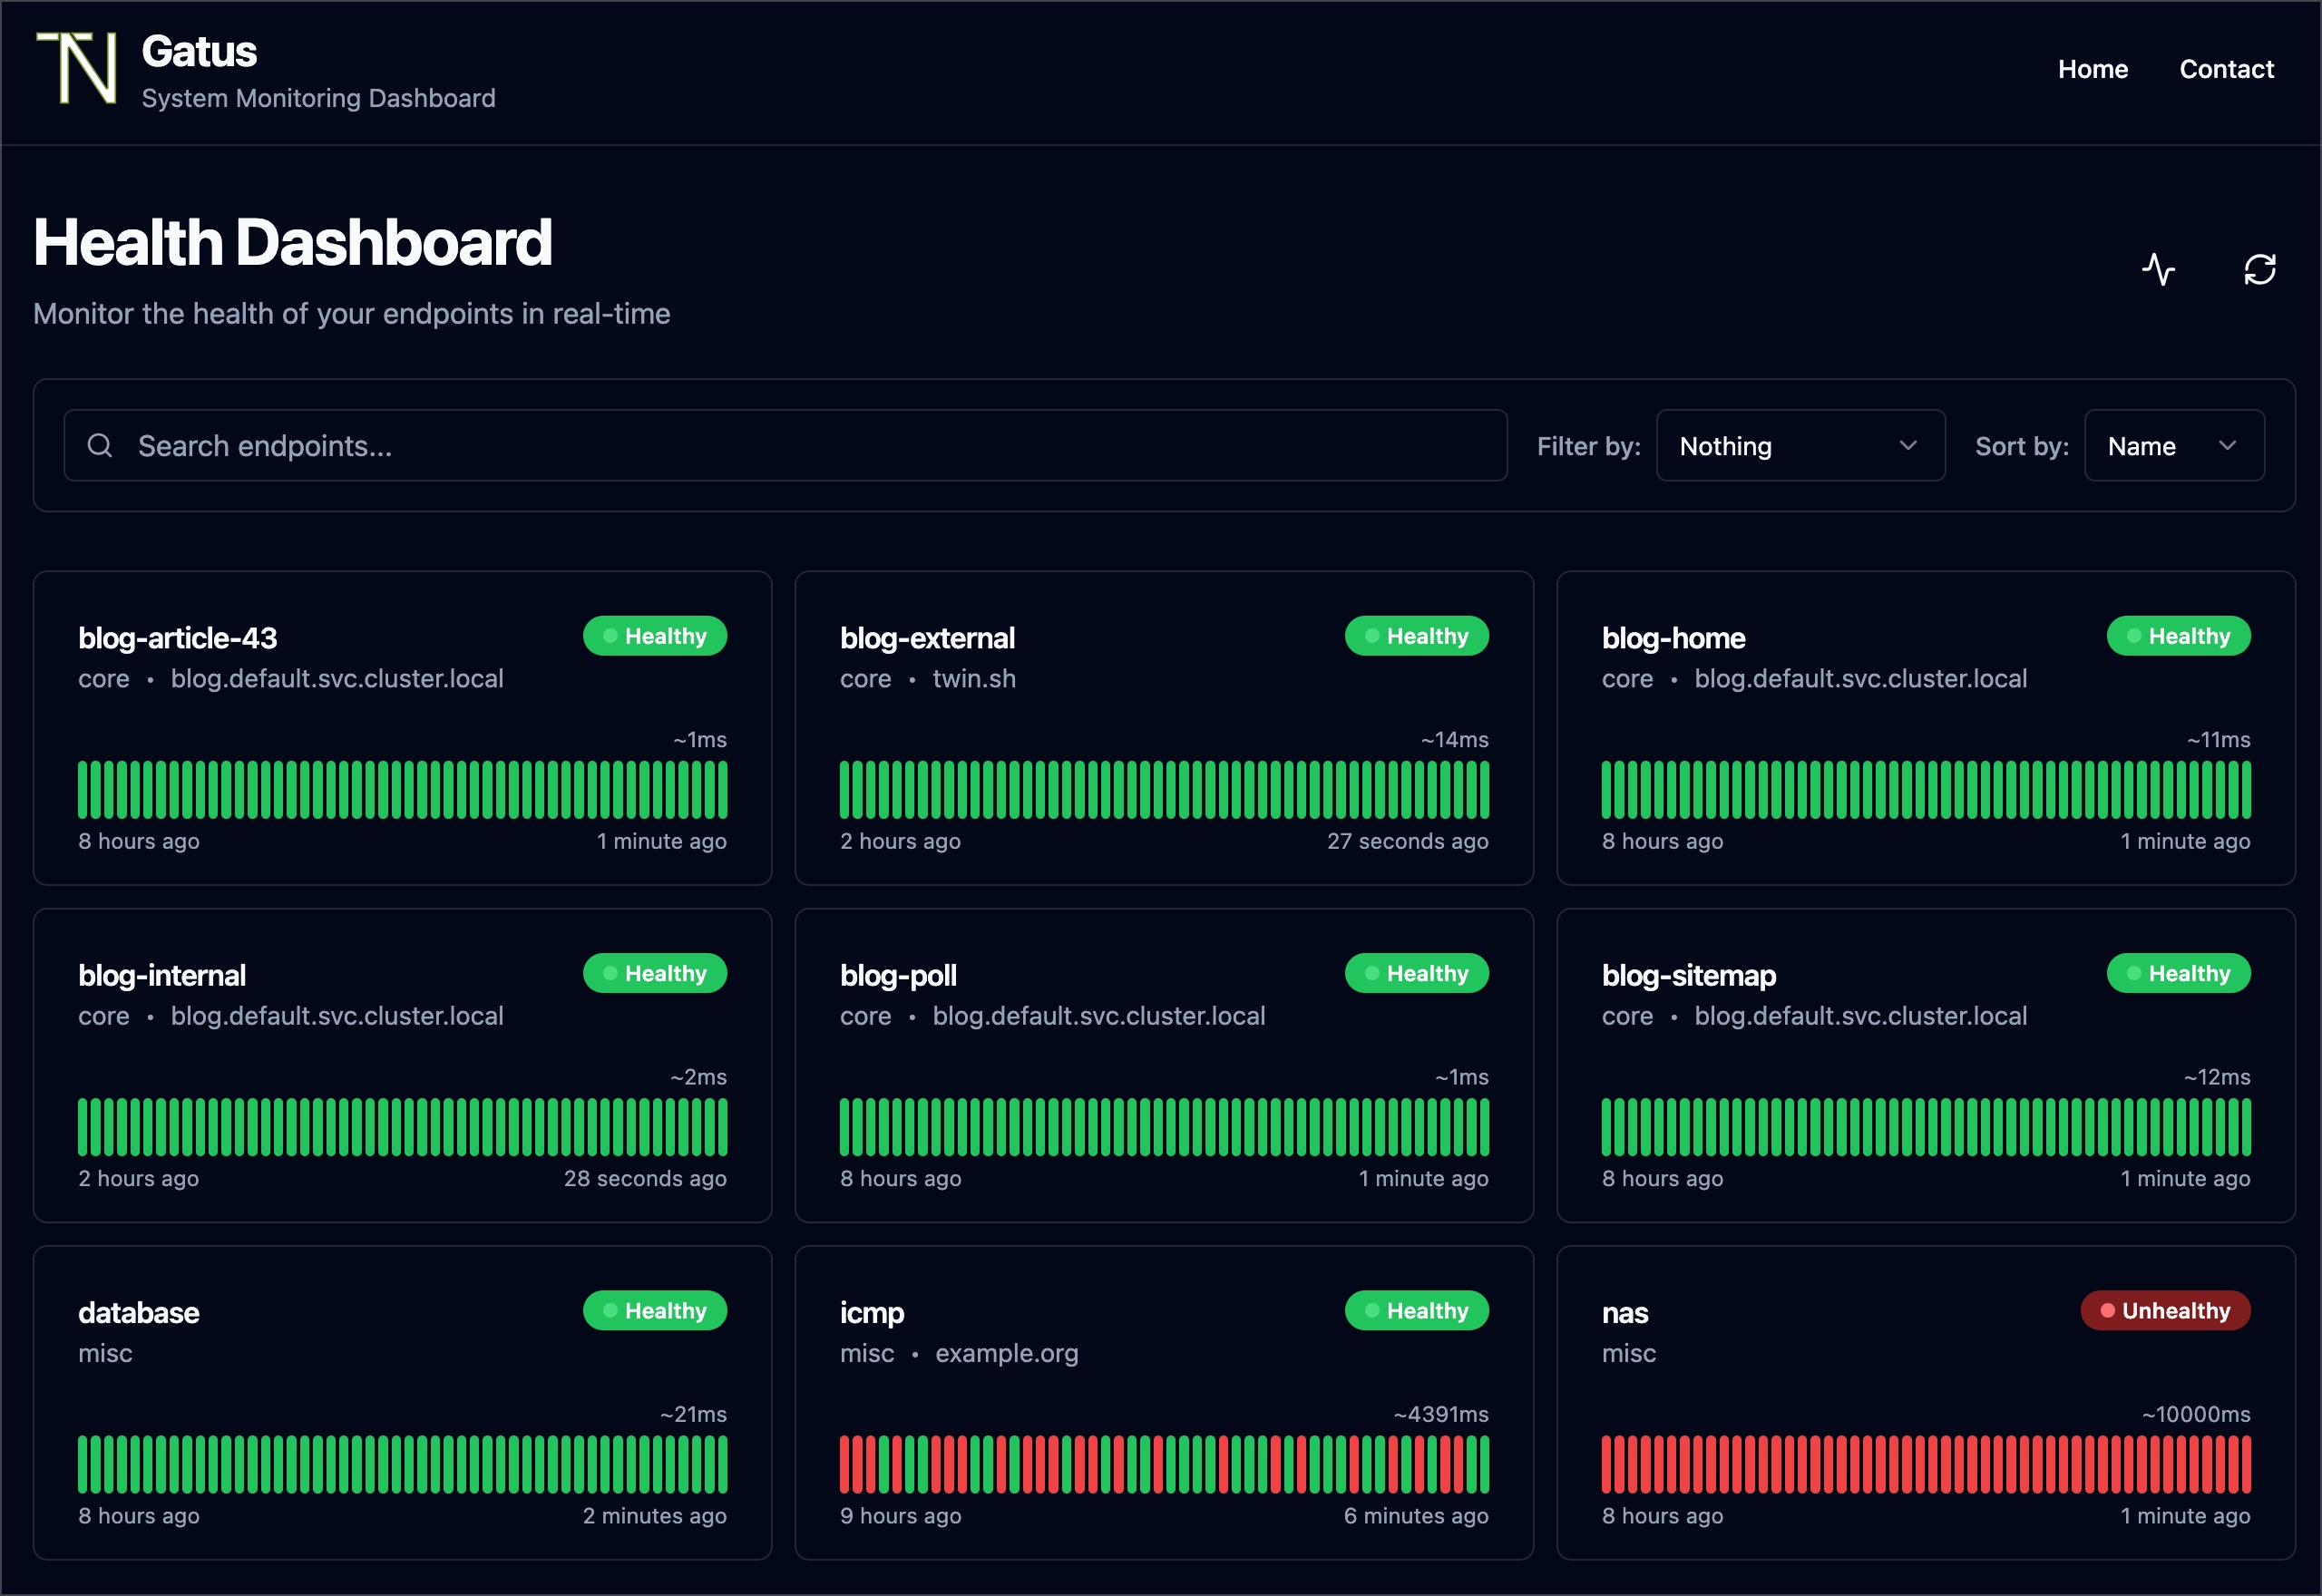
Tools that make it easy
You can build your own stack or use a service. The goal is stable, simple, and cost aware.
Open source options
- Prometheus with Node Exporter for metrics scraping and alerting.
- Grafana for dashboards and alert rules.
- Telegraf with InfluxDB for easy agent-based collection.
- Zabbix or Nagios for classic checks and SNMP.
Cloud and SaaS options
- AWS CloudWatch, Azure Monitor, and Google Cloud Monitoring.
- Datadog, New Relic, and Elastic for all-in-one views.
- UptimeRobot and Pingdom for simple external checks.
Pick what your team can run well. The best choice is the one you keep current. This is a key part of how to monitor server health metrics over time.

Step-by-step: how to monitor server health metrics
Here is a simple plan you can start today.
- Define goals and SLOs
- Set clear targets like p95 latency and error rate.
- Define uptime targets for core services.
- Note risks and what failure looks like.
- Baseline before alerts
- Measure normal CPU, memory, and I/O for two weeks.
- Note weekday and weekend patterns.
- Build your first dashboard from this view.
- Install agents and exporters
- Use Node Exporter or Telegraf on each host.
- Add app-level metrics with a simple client.
- Secure agents with TLS and least privilege.
- Create dashboards that group signals
- Make one overview per environment.
- Add drill-down boards by role, like web or DB.
- Place at-a-glance tiles at the top.
- Set alerts with context
- Alert on symptoms, not just causes.
- Include links to runbooks and logs.
- Route alerts by service and severity.
- Test your alerts
- Force CPU, kill a service, fill a disk in dev.
- Check that the right person got the alert.
- Fix false alarms fast.
- Review weekly
- Adjust thresholds using the latest data.
- Track new risks, like growth or new features.
- Share wins and incidents in a short note.
Follow these steps to master how to monitor server health metrics in any stack.
Alerting without noise
Too many alerts cause burnout. Too few alerts cause outages. You need balance.
Use multi-signal rules
- Combine error rate with latency and traffic dips.
- Add a time window to filter short spikes.
- Require repeat events before paging.
Tune thresholds
- Base rules on baselines and percentiles.
- Use dynamic alerts for day and night.
- Suppress alerts during deploy windows.
Route and escalate
- Send low issues to chat or email.
- Page only on user impact.
- Escalate if not acked in a set time.
This is the human side of how to monitor server health metrics. It keeps your team calm and ready.

Dashboards that tell a story
A good board reads like a short story. It shows cause and effect in order.
Layout tips
- Top row: uptime, errors, and p95 latency.
- Middle: CPU, memory, I/O, and network.
- Bottom: logs, deploys, and alerts.
Role-based views
- Web hosts: request rate, 4xx and 5xx, queue time.
- DB hosts: queries, lock waits, buffer cache, slow logs.
- Container hosts: node pressure, pod restarts, throttling.
A clear board is key to how to monitor server health metrics at a glance.

Capacity planning and forecasting
Capacity issues build slowly, then hit hard. Plan early.
Simple methods
- Track weekly growth in CPU and memory.
- Watch p95 disk latency over time.
- Use percentiles, not averages, for headroom.
Actions you can take
- Right-size instances and remove unused ones.
- Add caching or CDNs to cut load.
- Move batch jobs to off-peak hours.
This forward view is part of how to monitor server health metrics with care and control.

Common mistakes to avoid
I have made all these mistakes. You can skip them.
Mistakes
- Alerting on every spike, not on user pain.
- Ignoring disk space and inodes until it is too late.
- Missing logs in your alert context.
- Leaving runbooks out of alerts and dashboards.
- Not testing alerts with real failure drills.
Fixes
- Tie alerts to SLOs and user paths.
- Add disk and inode alerts with clear actions.
- Link logs and traces in every alert.
- Write short runbooks with exact steps.
- Run game days each month.
These fixes make how to monitor server health metrics far more reliable.
A quick troubleshooting playbook
When things break, follow simple steps. Move from user pain to root cause.
CPU spikes
- Check top processes and recent deploys.
- Look for noisy neighbors on shared hosts.
- Roll back or scale out if needed.
Memory leaks
- Watch RSS growth and GC pauses.
- Restart the service with a plan to patch.
- Add limits to stop node-wide impact.
Disk full
- Find large logs and rotate now.
- Clear old cores and temp files.
- Add alerts for 70, 85, and 95 percent.
Network blips
- Check packet loss and error counters.
- Compare zones and regions for scope.
- Reroute or fail over if needed.
This playbook is a hands-on way for how to monitor server health metrics under stress.
Personal lessons from the field
One Sunday, a quiet CPU graph hid a database lock storm. Latency rose, carts failed, and error logs screamed. The fix came when we saw p99 latency and lock wait time on one board.
Since then, I always track request rate, error rate, and p95 and p99. I tie alerts to these, not just CPU. This small change lifted uptime and dropped pages by half. It is a simple win for how to monitor server health metrics with impact.
Frequently Asked Questions of how to monitor server health metrics
What is the fastest way to start monitoring?
Use a hosted tool with a simple agent. Set one dashboard and two alerts on errors and latency.
Which metrics should I watch first?
Start with CPU, memory, disk space, and p95 latency. Add error rate and request rate next.
How often should I sample metrics?
Every 10 to 60 seconds works for most hosts. Use faster samples for critical paths or bursty loads.
How do I reduce alert noise?
Use multi-condition rules and time windows. Route low issues to chat and page only on user impact.
What dashboards should I build?
Create an overview board per environment and role-specific boards. Keep top tiles for uptime, errors, and p95 latency.
How do I monitor cloud servers differently?
Add cloud-specific metrics like throttling and credits. Watch service quotas and regional health events.
Conclusion
You now have a clear plan for how to monitor server health metrics. Track the right signals, build clean boards, and tune alerts to user impact. Add runbooks, test often, and review each week.
Pick one step today. Install an agent, set two alerts, and build one board. Then grow from there. If this helped, subscribe for more guides or share your own tips in the comments.