Use automated probes, health checks, and alerts to track availability in real time.
If you want to learn how to monitor server uptime, you are in the right place. I have led on-call teams and built uptime dashboards for years. This guide shows how to monitor server uptime with clear steps, proven tools, and easy wins you can apply today.
What is server uptime and why it matters
Server uptime is the time your server is reachable and works as expected. High uptime means users trust your service. Low uptime means lost revenue, churn, and stress.
Think of uptime like a heartbeat. It needs constant checks. When the heartbeat stops, your team must know at once and act fast.
Key reasons to care
- User trust grows when sites load on the first try
- SLAs and SLOs define what “good” looks like and protect revenue
- Early alerts cut downtime and reduce incident costs
When you learn how to monitor server uptime, you measure risk, prove reliability, and prevent surprises.

Core principles of uptime monitoring
Great uptime monitoring starts with a few simple rules.
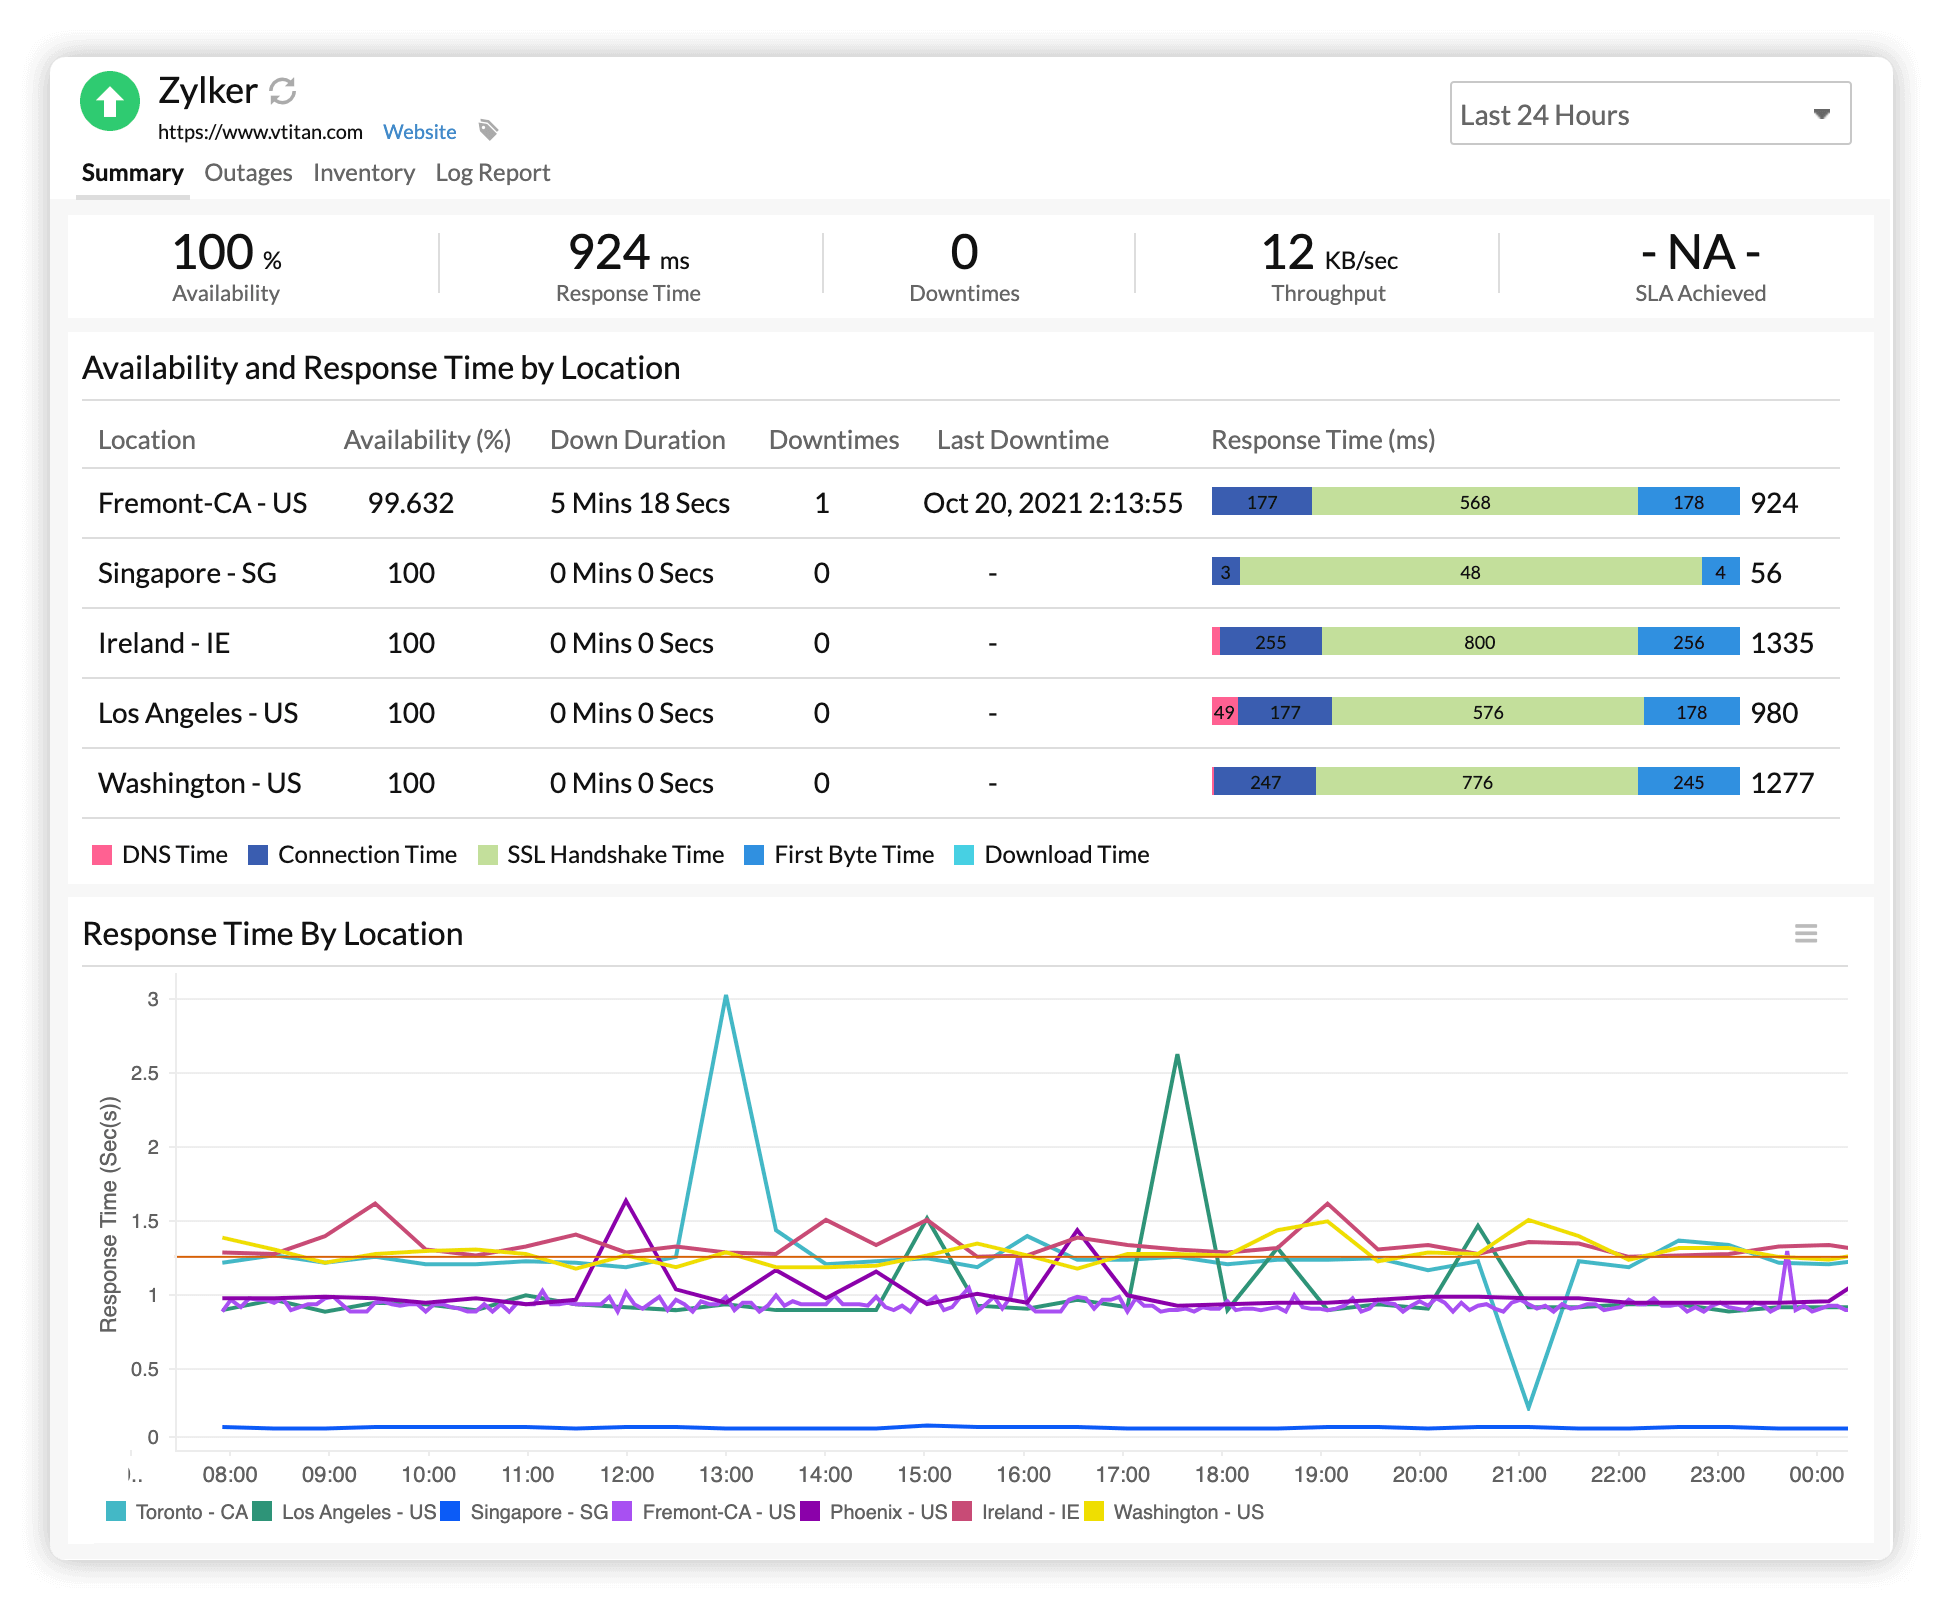
- Measure from the outside and inside External checks catch internet issues too. Internal checks find app errors fast.
- Use many vantage points Check from several regions or networks to avoid blind spots.
- Check the right thing Ping shows reachability. HTTP probes show if the app really works.
- Alert only on what matters Page people when users feel pain. Everything else can wait.
- Test your monitoring If you never test alerts, you will find gaps the hard way.
These principles guide how to monitor server uptime at any scale.
Step-by-step: how to monitor server uptime
Follow this practical path. These steps match how to monitor server uptime for small teams and large platforms.
- Define targets Write SLOs like 99.9 percent monthly uptime for the API.
- Pick checks Choose ICMP ping, TCP port checks, and HTTP 2xx checks with content match.
- Add health endpoints Use a lightweight /health route that returns OK only when deps are ready.
- Monitor from many places Use at least three regions to cut false alarms.
- Set intervals Start with 30 to 60 seconds per probe for user facing endpoints.
- Tune alert rules Alert after N failures across M regions to avoid noise.
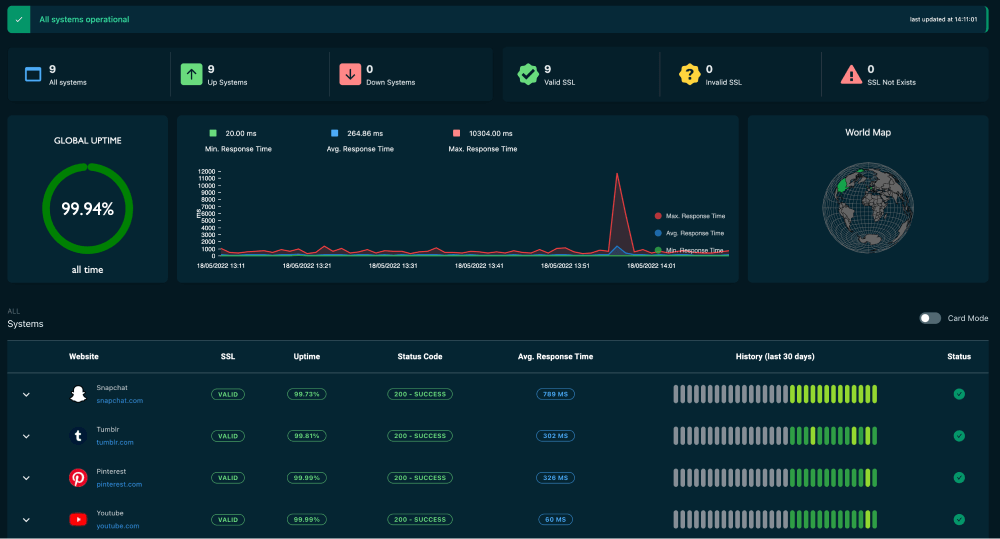
- Build dashboards Show uptime, latency, error rate, and incidents by service.
- Log every failure Keep timestamps, DNS, TLS, trace IDs, and response bodies for debug.
- Create runbooks Write step by step fixes for common errors and link them to alerts.
- Test the pipeline Break a service on purpose to verify alerts and paging work.
- Review weekly Track trends, tweak rules, and share wins and gaps with the team.
- Report uptime Share SLO results, error budgets, and actions with stakeholders.
This is the backbone of how to monitor server uptime with confidence.
Tools and methods you can use
You can mix open source, cloud, and SaaS tools. Start simple. Grow as needs change.
Open-source options
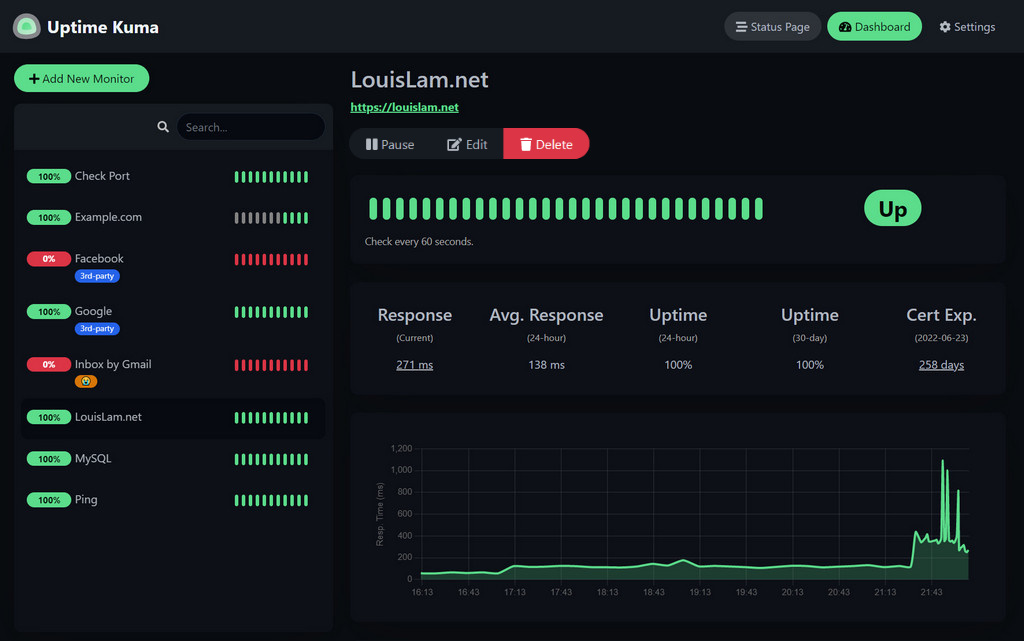
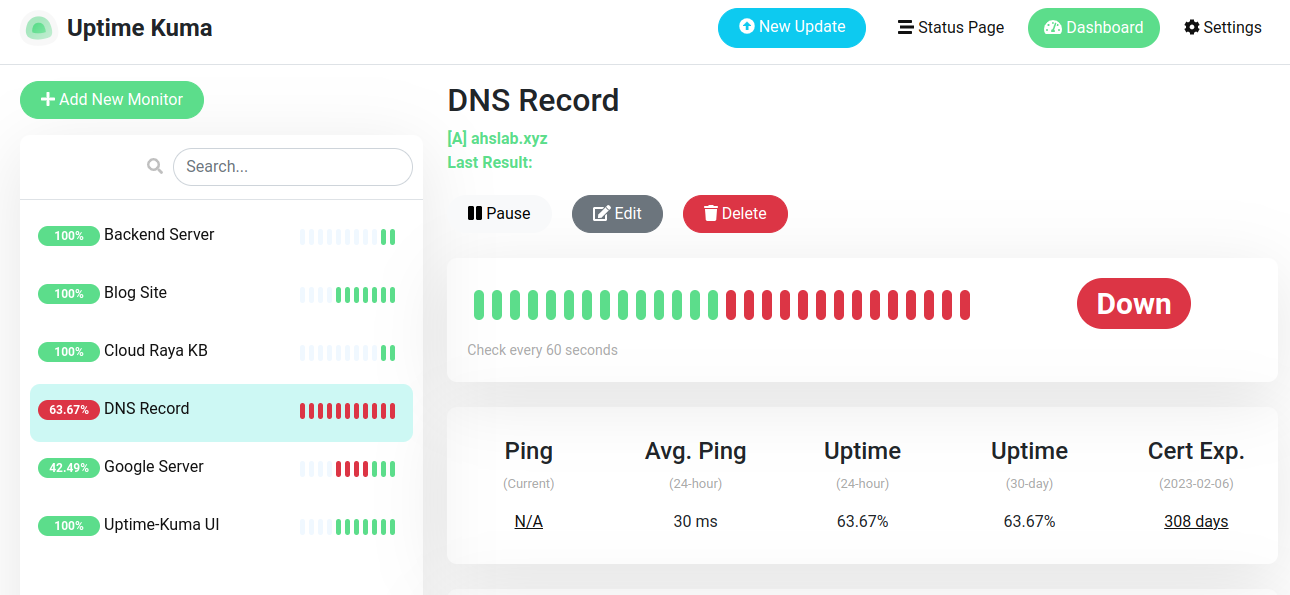
- Uptime Kuma Easy setup and nice status pages
- Prometheus with Blackbox Exporter Deep, flexible probes and labels
- Nagios or Icinga Mature checks and strong alert chains
- Zabbix All-in-one with agents and discovery
SaaS and cloud options
- Pingdom Easy external HTTP checks and reports
- UptimeRobot Fast setup and good for small teams
- Datadog Synthetics HTTP, TCP, SSL, and multi step tests
- New Relic Synthetics Browser and API flows with insights
- Grafana Cloud Synthetic Monitoring Probes in many regions
Methods to combine
- Synthetic monitoring Robots check endpoints on a schedule
- Real user monitoring Events from real users for true impact
- Internal health checks App level signals like DB or cache status
- Log and trace links Fast root cause during downtime
Use what fits your stack and budget. The best answer to how to monitor server uptime is the stack you will actually maintain.

Metrics, SLOs, and calculating uptime
Know what you measure before you alert on it.
Core metrics
- Uptime percentage The share of time the service worked
- Downtime minutes The minutes it did not
- Error rate The rate of 5xx or failed checks
- Latency P50, P95, and P99 response times
- Time to detect and Time to recover How fast you act and fix
Simple uptime math
- Uptime percent equals total time minus downtime, divided by total time, times 100
- A 30 day month has 43,200 minutes
- 99.9 percent allows about 43 minutes down
- 99.99 percent allows about 4.3 minutes down
- 99.999 percent allows about 26 seconds down
Use error budgets
- If your SLO is 99.9 percent, your budget is 43 minutes
- Spend the budget on safe changes and stress tests
- Freeze changes when the budget is low
Precision builds trust. This is how to monitor server uptime with clear goals.
Alerting without alert fatigue
Noise kills focus. Good alerts are rare, clear, and urgent.
Tips to cut noise
- Page on user pain Page on regional multi probe failures, not one probe
- Add short delays Alert after two to three failed checks
- Group by service Combine related failures into one page
- Use severity levels Sev 1 for main API, Sev 3 for a dev box
- Add context Include runbook links, graphs, and recent deploys
In my teams, this cut pages by half. It also sped up fixes. That is real progress in how to monitor server uptime.
Real-world setup example and lessons learned
I once rolled out uptime for 120 services. We used HTTP checks from five regions. We matched on a small JSON key to prove the app worked. We paged only after three regions failed in one minute.
What worked
- Health endpoints with DB and cache checks
- Clear runbooks with owners and test steps
- Weekly drills that proved our alerts worked
What failed
- Single region probes caused false alarms
- Vague alerts without logs slowed triage
- No blackout windows during deploys caused paging storms
Lessons for how to monitor server uptime
- Always probe from many regions
- Keep checks fast. Keep content match simple
- Tie alerts to owners and runbooks
Security, reliability, and governance
Monitoring must be safe and compliant.
Best practices
- Limit credentials Use read only tokens for checks
- Secure traffic Use TLS and pin certs where you can
- Rate limit probes Avoid DDoS like traffic to your own app
- Store less Keep only what you need for forensics
- Audit and review Track who changed alerts and when
- Align to SLAs Make reports match contracts and promises
Strong governance builds trust. It is part of how to monitor server uptime for serious teams.
Testing, chaos, and drills
If you do not test, you guess. Make failure a practice, not a surprise.
Ideas to try
- Synthetic failure Kill a process and confirm an alert fires
- Network chaos Drop packets between app and DB in staging
- Region failover Move traffic and time the recovery
- Maintenance windows Pause paging during planned work
- Game days Invite the team and learn together
Routine drills turn panic into muscle memory. That is how to monitor server uptime like a pro.
Common pitfalls and how to fix them
Avoid these traps. I have seen each one too many times.
- Only ping checks Use HTTP and content match to test real work
- One region only Add at least three regions for resilience
- Alert on every error Alert on user impact, not noise
- No runbooks Write clear steps and owners for each alert
- No postmortems Review incidents and fix root causes
- No reports Share uptime and error budgets every month
Fix these and you will master how to monitor server uptime without burnout.
Frequently Asked Questions of how to monitor server uptime
What is the easiest way to start monitoring uptime?
Use an external HTTP checker and point it at your main endpoint. Set alerts to email or chat and test them.
How often should I run uptime checks?
Every 30 to 60 seconds for public services is common. Lower frequency is fine for internal or less critical apps.
Should I monitor from multiple locations?
Yes. Multi region checks reduce false alarms and spot routing issues. It also shows regional performance.
Is ping enough to monitor servers?
Ping helps but it is not enough. Add HTTP or TCP checks to test the real service.
How do I measure uptime against my SLA?
Set your SLO and track downtime minutes each month. Report the percent and explain any breach with actions taken.
Which tools are best for small teams?
Start with Uptime Kuma or UptimeRobot for speed. Add Prometheus and Blackbox Exporter as you grow.
How do I avoid alert fatigue?
Group alerts, add short delays, and page on user impact only. Provide clear runbooks with each alert.
Conclusion
You now know how to monitor server uptime with a plan that works. Define clear targets, set smart checks, and tune alerts that matter. Test your system often and share results.
Pick one step to ship this week. Add a health check or set up your first external probe. Small steps add up to big gains in reliability.
Want more guides like this? Subscribe for fresh tips, or leave a comment with your stack and questions.